

By Anthony Dabbundo
As the Nov. 3 election day inches closer and closer, the candidates are ramping up spending dramatically to make their final pushes to the electorate. As more than 60 million votes have already been cast in the 2020 election, Donald Trump and Joe Biden combined to spend almost $14 million on Facebook and Instagram ads from their official campaign pages, and that does not include ads the campaigns have run from campaign surrogates, other state-specific and demographic accounts and the Vice Presidential nominees, which are now also available to view on the Illuminating 2020 Project Dashboard.
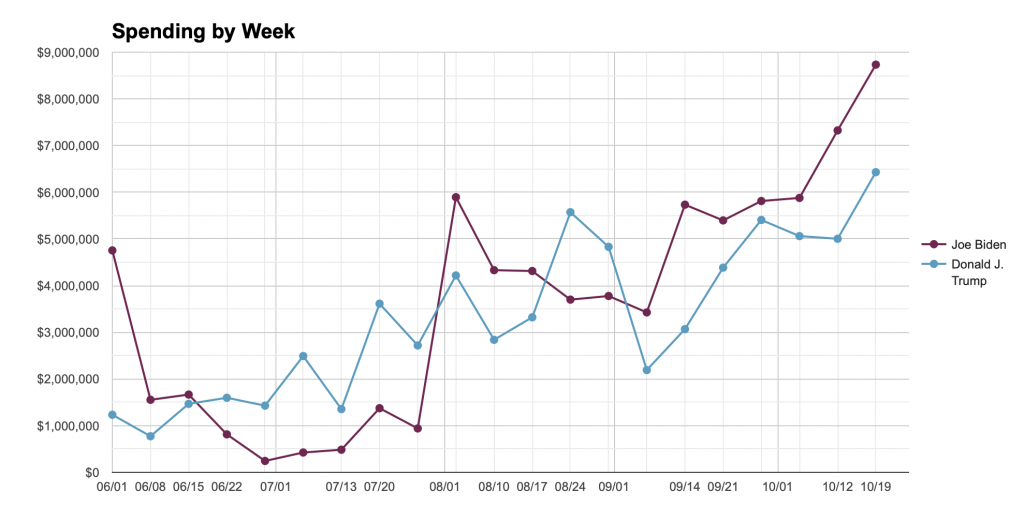
Biden outspent the President for the seventh week in a row in terms of total spending, with Biden crossing $7,645,394 and Trump totaling $6,418,699 in the week from Oct. 19-25. The overall trendline of spending since June has been steadily upward, as shown by the graph below.
Main Topics of Focus

President Trump’s main topic focus for ad spending in the week from 10/19-10/25 was on governance and economic themed ads. The President is trying to make his re-election pitch to voters, and one issue on which he has run multiple ads in the last week has been about his new Supreme Court pick, Amy Coney Barrett. Barrett was confirmed to the court by the Senate on Monday night, and Trump ran this ad over the weekend, asking people to congratulate Barrett and support her confirmation.
Overall, Trump spent $393,563 on governance messaging and $338,120 on ads about the economy (10/19-10/25). On the other side, Biden’s two main topics of ad spending were COVID-19 and the economy. We saw that Biden’s COVID-19 spending consistently ran ahead of the President throughout most of the fall, until the President himself was diagnosed and hospitalized with the virus. In the first week of October, Trump’s spending on virus-related messaging spiked.
Trump continues to attack Biden’s record
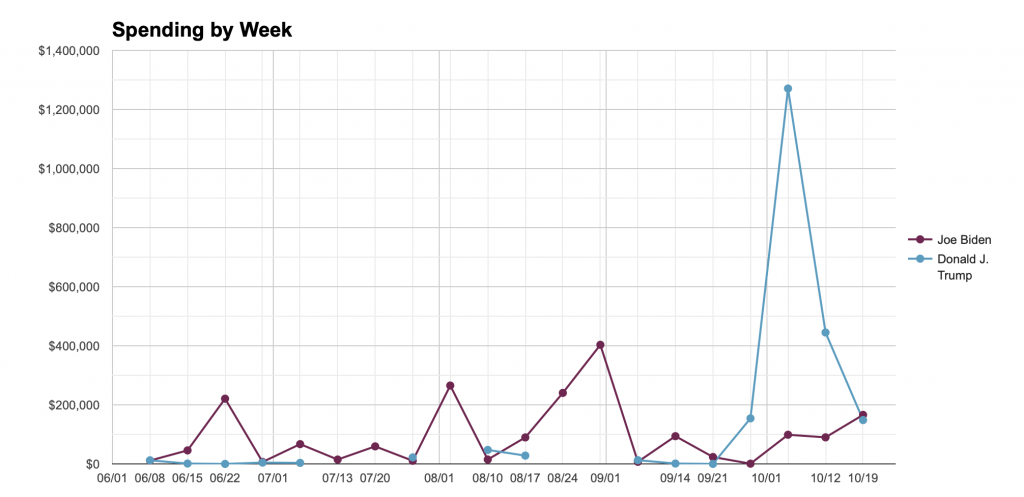
One underlying theme that has persisted throughout the campaign has been the differences in message type for the two candidates. Biden has made plenty of attacks on Trump, especially on COVID-19 and the nationwide protests in June. In those moments, he ramped up attack ads dramatically. However, Biden has made his campaign much more focused on advocacy and persona messaging, trying to improve his own standing with people. In the week from Oct. 19-25, Biden’s most popular ad type was advocacy, with call to action second and persona third. Compare this to Trump, who has spent the entire fall trying to hurt Biden’s favorability ratings by running attack and issue ads. Trump spent more than $2.6 million on attack ads in the week from Oct. 19-25, more than persona and advocacy.
As shown in the chart below, Trump’s spending on attack ads has been consistently higher than Biden’s, with the exception of a spike in early June.
A return to civility for Trump campaign’s attacks
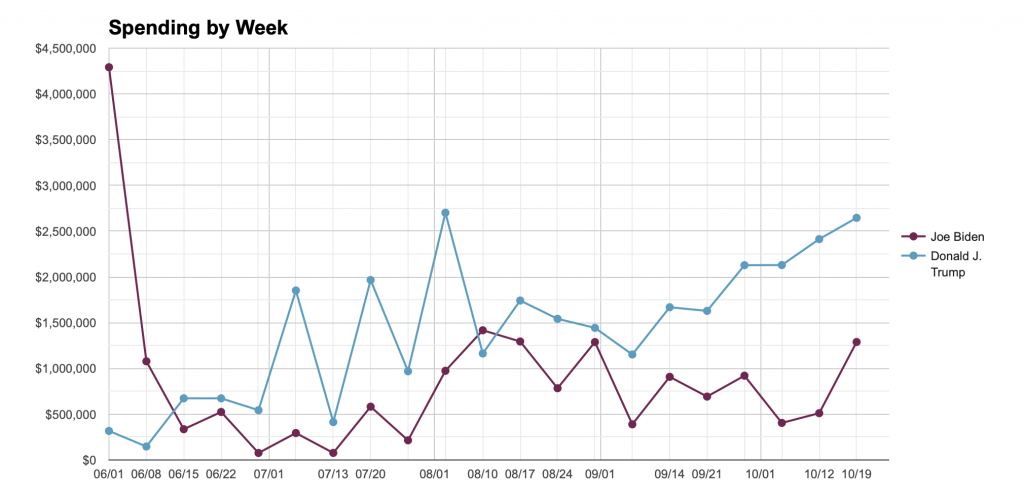
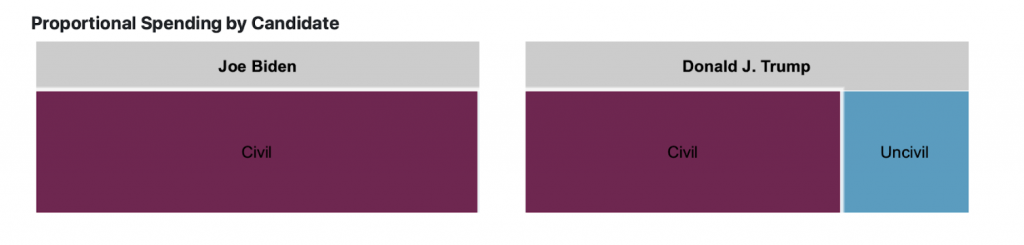
The week from Oct. 12-18 was Trump’s most uncivil since July, when filtering for attack ads. This did not continue into this week, when the majority of his attack ads were rated as civil. One major difference between the two candidates throughout the course of the campaign on attack ads is that Trump’s attack ads have been rated as majority uncivil, while Biden’s attack ads have maintained their civility. Overall, when considering all ad types, both campaigns have been majority civil. However, that’s not always the case for attack ads.
The graph below shows civility on attack ads only, where it’s clear that Trump’s ads have been less civil than Biden’s.
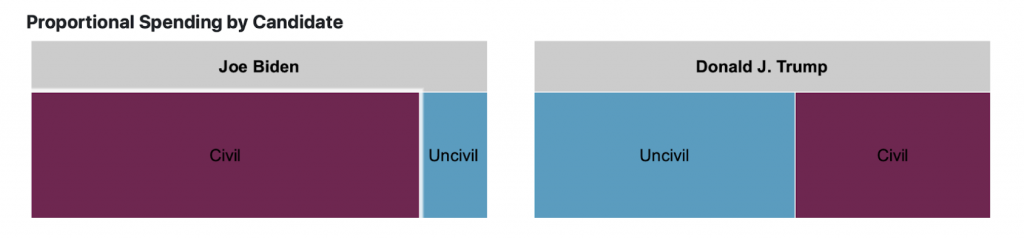
In the week from Oct. 19-25, Trump spent $1,937,768 on civil attack ads, compared to $699,428 on uncivil attack ads. Compare this to Biden, who spent $1,091, 287 on civil attack ads. The breakdown is shown in the graph below.
It’s all about Pennsylvania (and Florida, too)
According to FiveThirtyEight’s election forecast, Pennsylvania is the likeliest state to be the tipping point state, or the state that will put the winning candidate above the required 270 electoral college votes. Meanwhile, Florida is the largest toss-up state in terms of population and electoral votes. The two states have received constant attention from both candidates, including town halls, visits, rallies and political ads.
One interesting trend emerging from those two states, is that Biden’s main topic of focus in those two this week is COVID. Also, both campaigns most targeted age group in PA is the 35-44 and 25-34 age groups. Even though Trump’s most targeted age group overall is typically 55-64 and 65+. In this late Pennsylvania push, that has not been the case.
Meanwhile, in limited spending amounts, Democratic Vice Presidential nominee Kamala Harris’ most targeted age group in Pennsylvania and Florida combined has been the 65+ age group.
In these two states, the President’s top two messaging types are governance and safety, which is different from nationally, where the economy has been prioritized over safety in terms of topic spending.
In total, both candidates spent more than $1 million each last week in Florida and Biden spent more than $1 million in Pennsylvania, while Trump ended up just short of $500,000. These two states, along with Michigan, Arizona, North Carolina and Wisconsin, are likely to decide the next President of the United States.
As the campaign enters the final week, they’ll make their final pitch to voters.
All data is accurate as of date of publication. All spending and impression amounts are estimates based on data provided by the Facebook Ad Library API. Featured image for this post is by Markus Spiske on Unsplash.