

FiveThirtyEight’s election coverage includes a page with a snake chart that visualizes how closely contested each state is. The states in the middle of the snake are the most contested. Towards the last week of September, the states closest to the snake’s center were Iowa, Georgia, Ohio, North Carolina, Florida and Arizona, with the first three leaning towards Trump and the last three leaning towards Biden. (Since September 28th, Ohio has shifted to leaning towards Biden).
It’s possible that campaigns have different strategies depending on if a state leans towards them or their opponent. We can investigate if this is true on Facebook by asking: Do campaigns have different strategies depending on if a state leans toward them or their opponent?
To answer this question, I gathered data from the Illuminating site from Monday, 31 August 2020, to Sunday, 27 September 2020, for the six contested states that FiveThirtyEight identified: Iowa, Georgia, Ohio, North Carolina, Florida and Arizona.
We can’t look at raw dollar amounts for these comparisons since more money is spent in some states than others. For example, Florida has a population of over 21 million, but Iowa has just over 3 million, so it seems reasonable for campaigns to spend more in Florida. We also know that campaign posts can be categorized with multiple message types. That is, a post could be tagged as Attack and Persona at the same time. So looking at how much was spent on Attack vs Persona as a percent of total ad cost is misleading because both ad type totals will have some of the same dollars in them. In other words, if we add the total spent on each ad type, it always equals more than the total dollars actually spent on ads.
To address these concerns, I use averages and percentages for my analysis, as I did in a previous post. As we will see, the strength of the approach is that it allows for uniform comparisons of spending profiles between states and/or between candidates. By spending profiles, I mean, which kinds of messages are being prioritized in terms of spending at the expense of other types. So we can see if, for example, Biden is prioritizing Persona type messages at the expense of Issue type messages in one state, while in another state he prioritizes issue messages at the expense of other types. Likewise, we can also use this to compare Biden’s spending profile in, say, Arizona to Trumps in Ohio.
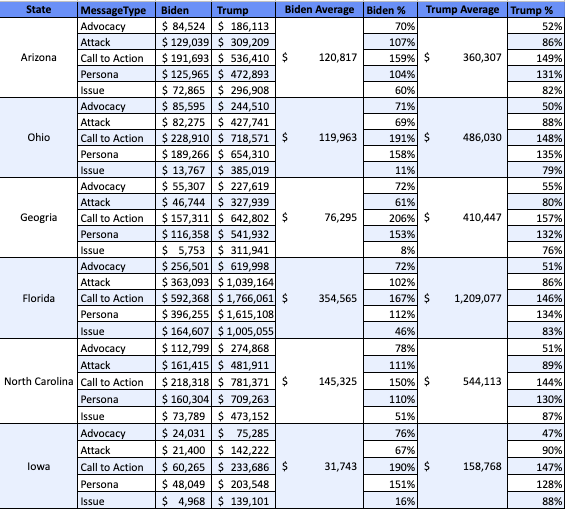
To recap how this works, for each state, I find the average amount of money that each candidate spent across all five message types for the date range. Taking Biden’s Florida campaigning as an example, his spending between 31 August and 27 September averaged $354,565 USD on ads with our message types. This average can be used as a baseline against which we can compare Biden’s average spending for each individual message type. For instance, Biden spent $363,093 on attack ads in Florida, which is 102% of the baseline average. This indicates that Biden spent more on attack than the average he spent across all message types—in contrast to attack, his campaign only spent $164,607 on Issue, which is 46% of the baseline average. This difference suggests that issue messaging was a lower priority in Biden’s targeting of Florida voters. But the real advantage to doing the analysis this way comes when we compare across states, or across candidates.
We can more easily make comparisons across states and candidates using a graphic, like the one below. In it, I calculated how much Trump’s and Biden’s campaigns spent in each state, on average, across the five message types (see column labeled “Biden Average” in the table). Next, I calculate the percentage spent on each message type against the average across all the types (column (Biden %”). If you look in the “Biden %” column for Georgia, for example, Biden spent 206% of the average on Call to Action but only 8% of the average on Issue. Clearly the Biden campaign felt that Call to Action was far more important than ads that focused on Issues!

With this data, we can assess whether Trump’s and Biden’s campaigns have different priorities for states that lean toward them vs. states that they are trying to flip in their favor. The states in the above plot are ordered as they are on Fivethirtyeight’s snake plot: Arizona leans the most toward Biden, followed by Florida, and then North Carolina, while Ohio leaned towards Trump for most of September, with Georgia and Iowa showing stronger support for Trump.
First, we can look at Trump’s spending: by and large, Trump is spending similarly regardless of whether the state is leaning towards him or Biden. There are some small differences—for example, in Georgia, Trump’s emphasis seems to be on call to action and advocacy messaging, which comes at the expense of attack and issue spending. Trump may be playing defense in Georgia by ensuring his base stays engaged with calls to action and advocacy. Still, Trump’s advertising across the six states is relatively consistent, regardless of whether the states lean toward or away from him.
The story looks different for Biden. Remember: The states on the plot are ordered by their leaning during September, starting with Biden (Arizona, Florida and North Carolina) and transition to Trump (Ohio, Georgia, Iowa). In the shift from North Carolina to Ohio, there is a pretty clear change in the Biden campaign’s advertising. In states that Biden wants to flip, like Ohio, his messaging focuses less on issues more on calls to action.
It could be that Biden is trying to drive people to his site or to watch his campaign’s videos. Or perhaps he wants voters to get to know him. This possibility is supported by other findings in the plot: Biden’s persona messaging is noticeably higher than his attack messaging in states that lean toward Trump. Instead of attacking Trump, Biden could be trying to present a different view of himself than the picture the right-wing media is trying to paint of him.
In states that are already leaning toward Biden, he is still investing heavily on Call to Action ads, but he is also prioritizing Attack messaging.
There are also some subtle differences among the states that already support Biden. For example, spending on calls to action is higher in Florida, while issue spending is lower. It could be that Biden is calling on his core base of supporters to vote or donate, or it could be that he’s trying to appeal to voters who are less familiar with his platform to visit his website or watch his videos.
Note that since September, Ohio has slipped into Biden’s camp, according to FiveThirtyEight. It might be interesting in a couple of weeks to see if Biden’s strategy changes for Ohio to be more like the states now in his camp.
All data is accurate as of date of publication. All spending and impression amounts are estimates based on data provided by the Facebook Ad Library API. Feature photo by Morgan Lane on Unsplash.
i like your article, what is your motivation to be a writer?