

by Ania Korsunska, Jennifer Stromer-Galley, Brian McKernan, Patricia Rossini, Jeff Hemsley, Sarah E. Bolden, and Wenzhe Yang
Between June 1 and November 1, the Biden and Trump campaigns spent $217 million on Facebook and Instagram ads in their bids to win the 2020 U.S. presidential election.* Our previous report examined the overall Facebook ad expenditures by each candidate, the targets of their ads, and the tone and type of advertisements they ran.
This companion report explores the topics of the ads each campaign ran on Facebook and Instagram. We used computational techniques to classify the topics in each ad. For descriptions of what was included in each topic, see our category descriptions and our topics post, which includes examples of ads for each topic category. It is worth noting that the topic categories are not mutually exclusive, so one ad can be labeled in none, multiple or all topic categories as applicable. Brief details of our methodology are available in our Identifying Political Topics in Social Media Messages post.
Overall Focus
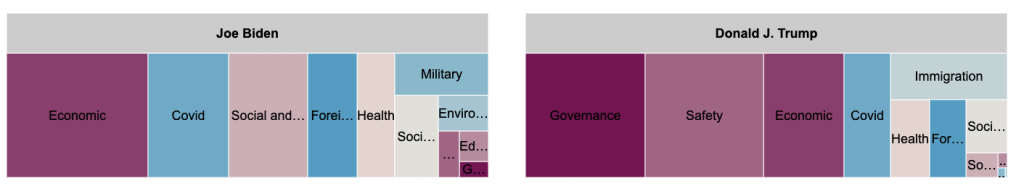
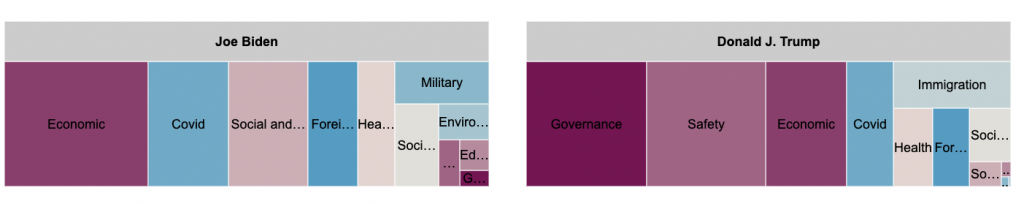
The top three topics present in ads from Biden’s main Facebook page were social and cultural issues ($3.7m), economic issues ($3.3m) and issues related to foreign policy ($2.4m) (see Figure 1 and Table 1). Overall, Biden spent the least on ads discussing immigration ($5k) and issues of safety ($160k). For the Trump campaign, the top spending topic categories from the campaign’s main Facebook page were governance ($6.9m), safety ($5.9m) and economic issues ($3.9m). Trump spent the least on ads discussing the environment ($13k) and military ($23k).
| Candidate | Donald J. Trump | Joe Biden |
| Governance | $6,884,630 | $181,183 |
| Economic | $3,928,055 | $3,259,495 |
| Safety | $5,882,274 | $160,416 |
| Education | $46,229 | $172,486 |
| Social and Cultural | $430,174 | $3,694,660 |
| Health | $991,710 | $824,649 |
| Social Program | $731,540 | $618,694 |
| Immigration | $1,845,652 | $5,655 |
| Environment | $13,949 | $340,800 |
| Military | $23,017 | $732,413 |
| Covid | $2,173,130 | $2,110,051 |
| Foreign Policy | $1,647,096 | $2,366,754 |
Topic Spending Over Time
Analyzing topic spending over time shows spikes in spending and changes in ad strategy in response to current events. Overall, only a few spikes are evident in the topics that Biden focused on in the period from June 1 to November 1 (see Figure 2).
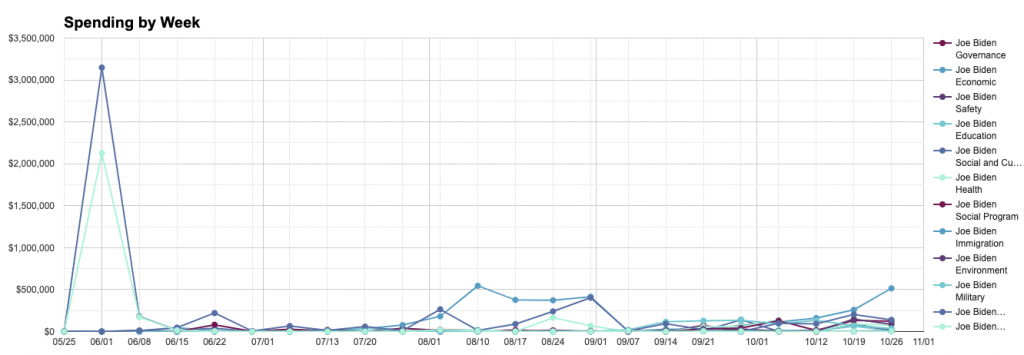
We see a very clear spike in Biden’s ad spending on social and cultural ($3.1m), and foreign policy ($2.1m) the week of June 1st, 2020, followed by smaller spikes for the COVID-19 category the weeks of August 24 -31, and in the economic topic category the weeks of August 24 – 31 and October 26th.
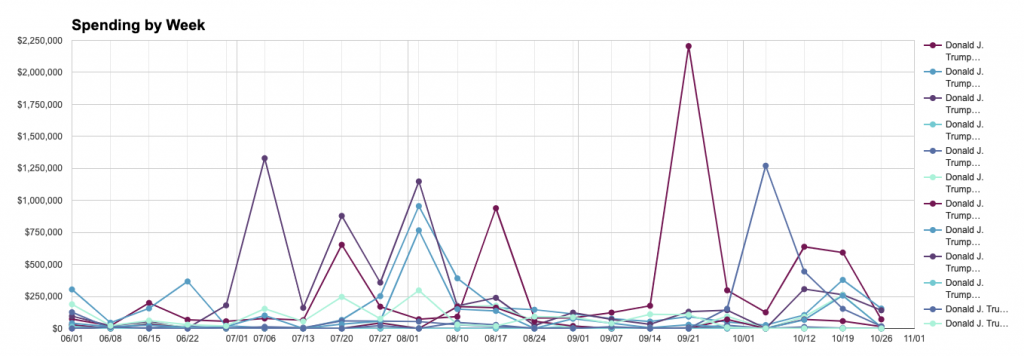
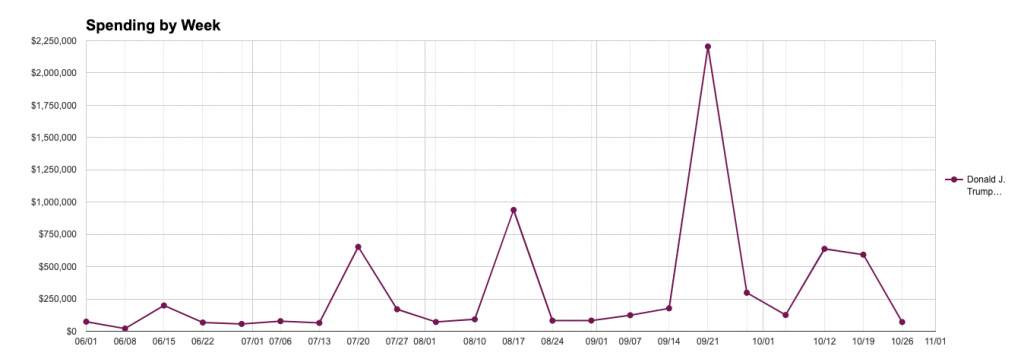
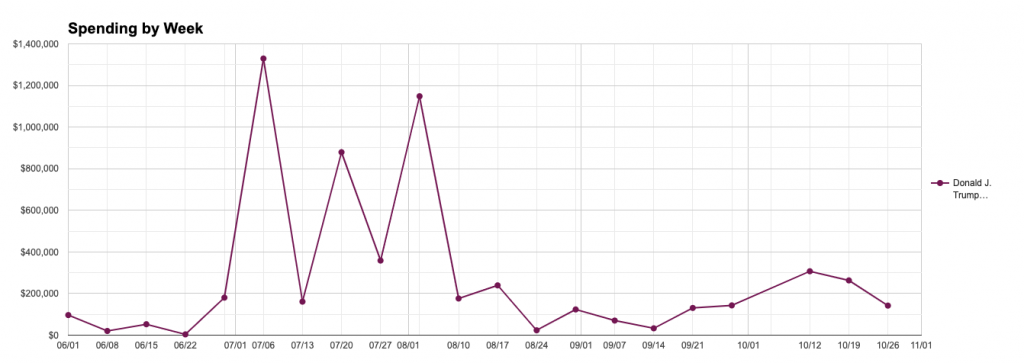
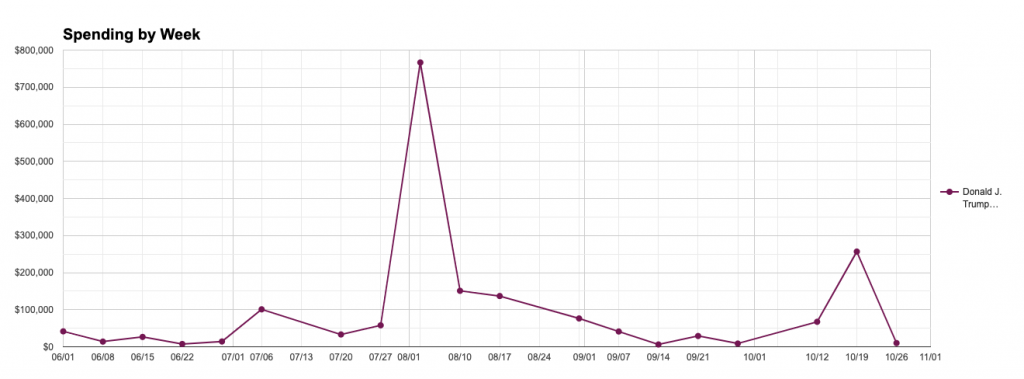
When looking at Trump’s topic spending between June and November, there are a few distinct spikes in the spending for certain topics, such as COVID-19, governance, safety and immigration (see Figure 3).
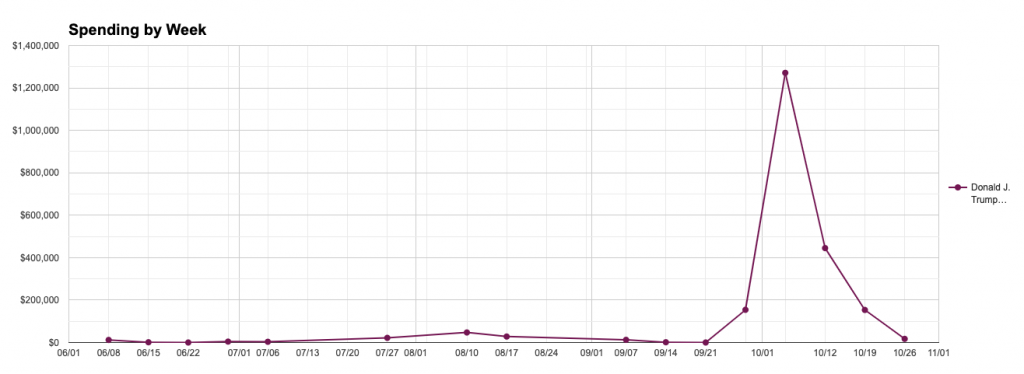
Some shifts in strategy happened around relevant campaign events. For instance, in the week of October 5, The Trump campaign sent an estimated $1.3m on COVID-related ads that ran on the campaign’s main page, which coincided with his announcement that he and the First Lady were diagnosed as COVID-19 positive on October 2nd. As Trump recovered, spending on the topic also diminished over time (see Figure 4).
Trump’s governance-focused spending also had a few significant spikes, the largest being in the week of September 21 ($2.2m), with smaller spikes prior on during the weeks of August 17 ($939k), July 20 ($654k) and June 15 ($199k) and after, October 12-19 ($638k and $593k) (see Figure 5).
The safety topic also received increased attention the weeks of July 6 ($1.3m), July 20 ($879k) and August 3 ($1.1m), potentially related to the protests around the Black Lives Matter movement (see Figure 6).
The final noticeable spike in Trump’s topic spending over time is a large increase in immigration-related ads the week of August 3 ($767k) (see Figure 7).
Topic Spending in the Battleground States
We can also look at the battleground states (Arizona, Michigan, Pennsylvania, Florida, Iowa, Minnesota, New Hampshire, North Carolina, Ohio, Texas, Georgia and Wisconsin) to see if the candidates employed different topic strategies compared to their nation-wide strategy (see Figure 8).
Biden’s overall top spending topics were social and cultural issues, economic issues, and issues related to foreign policy, but in the battleground states we see a much higher focus on COVID-19 related advertisements ($1.4m), though the same three remain at the top as well: economic ($2.5m), social and cultural ($1.4m) and foreign policy ($848k). For Trump, the top three topics were the same for the battleground states as for his overall strategy nationwide – governance ($4.4m), safety ($4.3) and economic issues ($2.9m).
Topic Spending From The Additional Campaign Pages
Campaigns ran ads from many additional pages: 37 additional pages for Biden, plus Sen. Kamala Harris’s account and 24 additional pages for Trump, plus VP Mike Pence’s account. For a spending breakdown for these pages, see the 2020 Illuminating report.
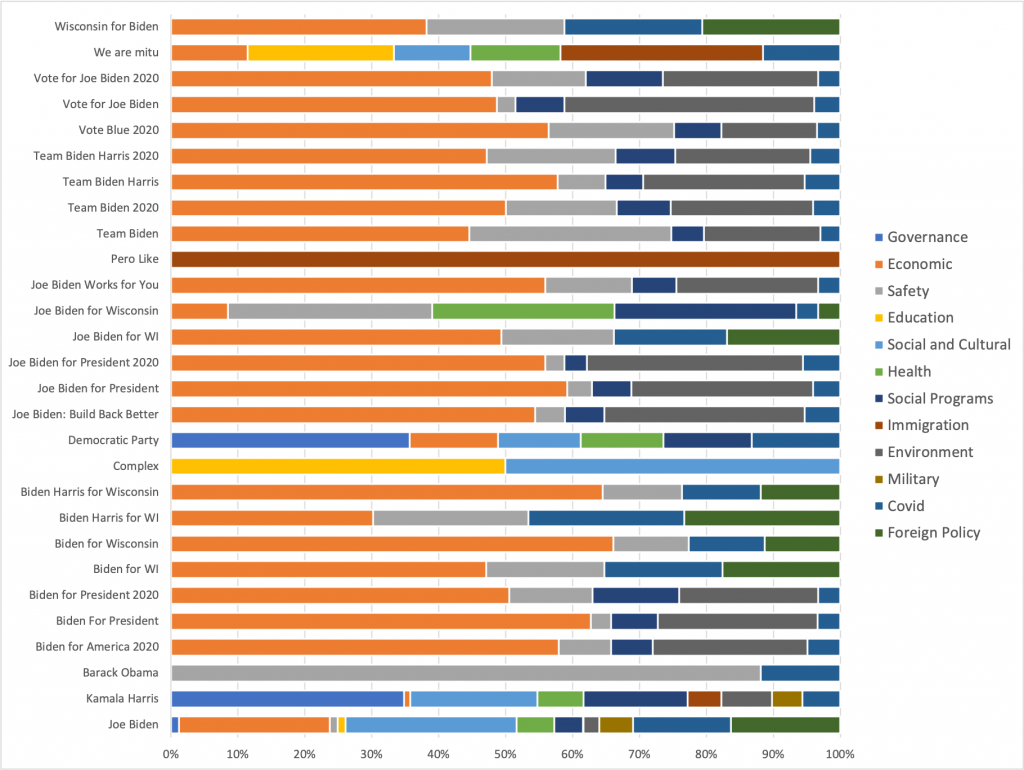
From Figure 9, we see that most pages focused on economic issues, but the Pero Like page focused exclusively on immigration, while Sen. Kamala Harris’s page focused more on governance, social and cultural, and COVID-19 issues. Ads on pages “Joe Biden for Wisconsin” and the “Barack Obama” had a strong focus on safety, while Biden campaign ads on the “Democratic Party” page focused mostly on governance.
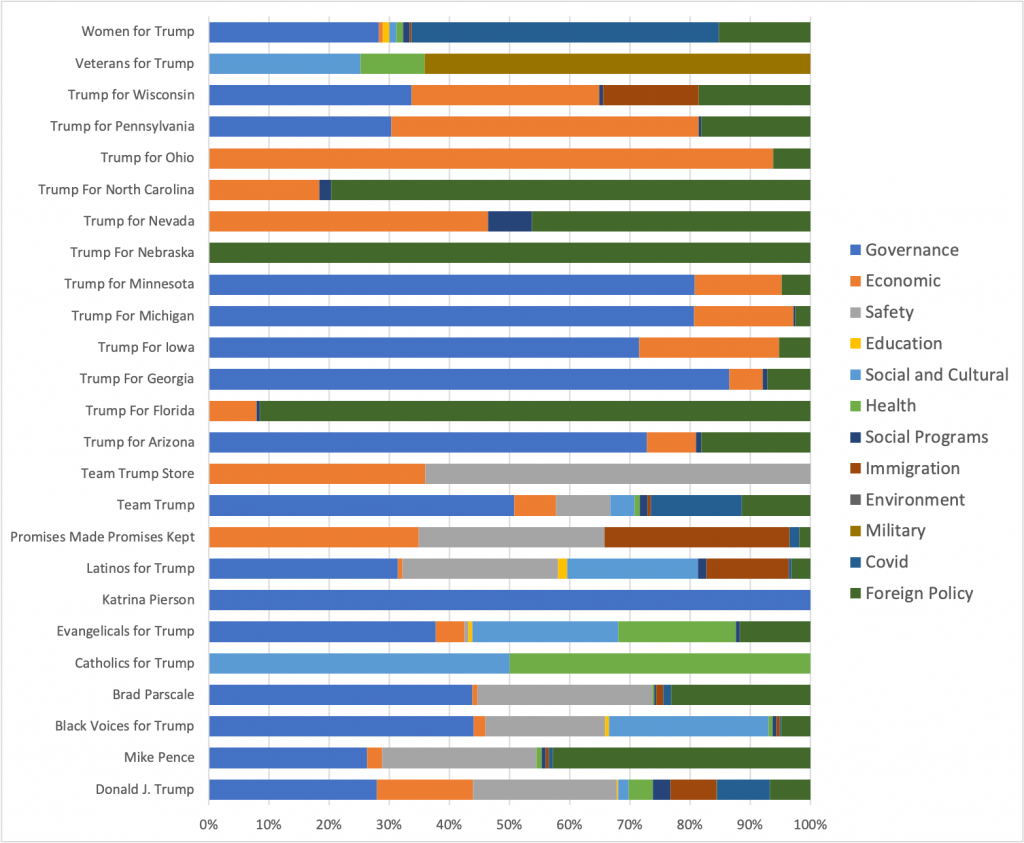
The additional Trump pages focused on governance ads, though Trump for Nebraska exclusively focused on foreign policy (see Figure 10). Foreign policy was also a focus in the Trump for Florida and Trump for North Carolina pages, though these pages also focused on economic issues and social programs in their ads. Catholics for Trump appears to split its spending evenly between social and cultural and health messaging, while Katrina Pierson’s page focused on governance messaging. Veterans for Trump, not surprisingly, had the largest focus on military topic ads.
The analyses in this report are based on data that we pulled from Facebook’s ad library, including the meta-data associated with each ad: spend range, impressions range, target gender, target age, target state. All estimates provided in this report are for Trump and Biden’s main Facebook pages unless otherwise stated.
* This estimate is based on combined spending by the Trump and Biden campaigns across all pages between June 1 and November 1, 2020.
**The figures do not include estimates for spending after November 1st, 2020.