

By Jennifer Stromer-Galley, Brian McKernan, Patrícia Rossini, Jeff Hemsley, Sarah E. Bolden, Ania Korsunska
Former Vice President Joe Biden and President Donald Trump spent a historic $217 million advertising on the Facebook and Instagram social media platforms during the 2020 general election.*
This report provides analyses by the Illuminating 2020 project at the School of Information Studies at Syracuse University. We studied the Facebook and Instagram advertising by the two general election candidates between June 1, 2020 and November 1, 2020. We tracked overall Facebook ad expenditures by the candidates, the targets of the ads, and we used computational techniques to categorize the tone, topic, and type of advertisements. Details of our methodology are at the end of the report.
We’ve also published a companion 2020 Message Topic report and related methodology.
Overall Spending and Trends
Between April 9 and October 25, Trump and Biden spent approximately $991 million on advertising across television, radio, print, and digital media. Of the ads associated with Trump’s and Biden’s main Facebook and Instagram campaign pages, the Biden campaign spent $76.9 million and the Trump campaign spent $87.2 million between June 1 and November 1.
The general election campaigns spent substantially more on the Facebook platforms—Facebook and Instagram—this election cycle as compared with 2016: Trump spent approximately $44 million, while Clinton spent $28 million between June and November, according to a Facebook report.
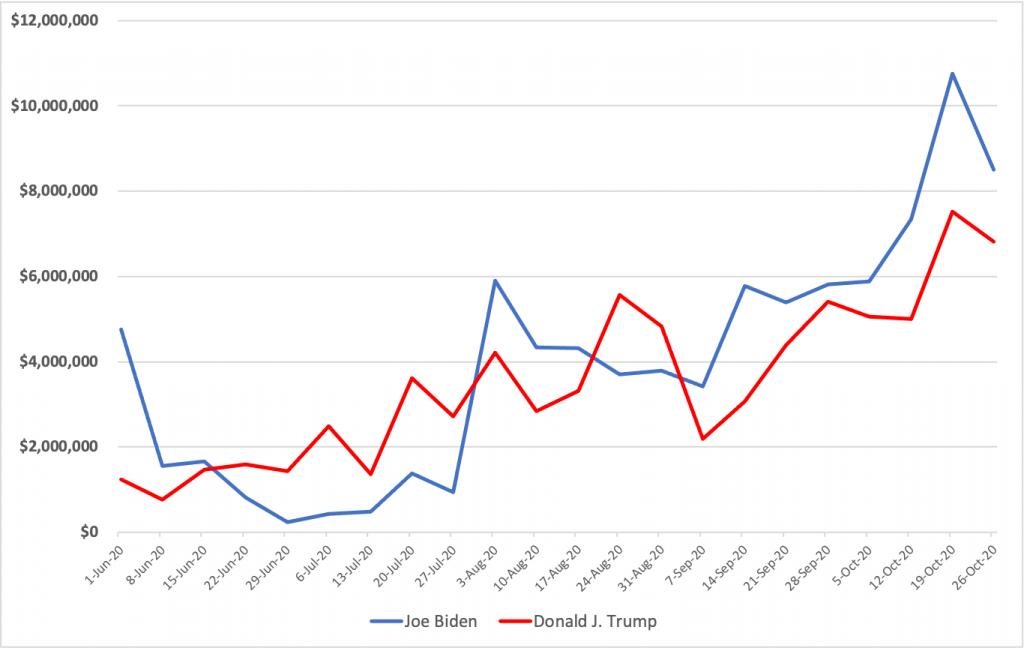
Although the Trump campaign spent more on Facebook overall across all pages, Biden outspent Trump if looking only at the main candidate pages. This is especially clear between October 5 and November 1, 2020. During this time period, Biden outspent Trump 4:3 from his main page. Biden also outspent Trump across all pages the campaigns ran ads from during that time period. Biden had his largest new ad buys on Facebook over the week of the final presidential debate, which took place on October 22, spending over $10 million as compared with Trump’s $7.5 million (See Figure 1).
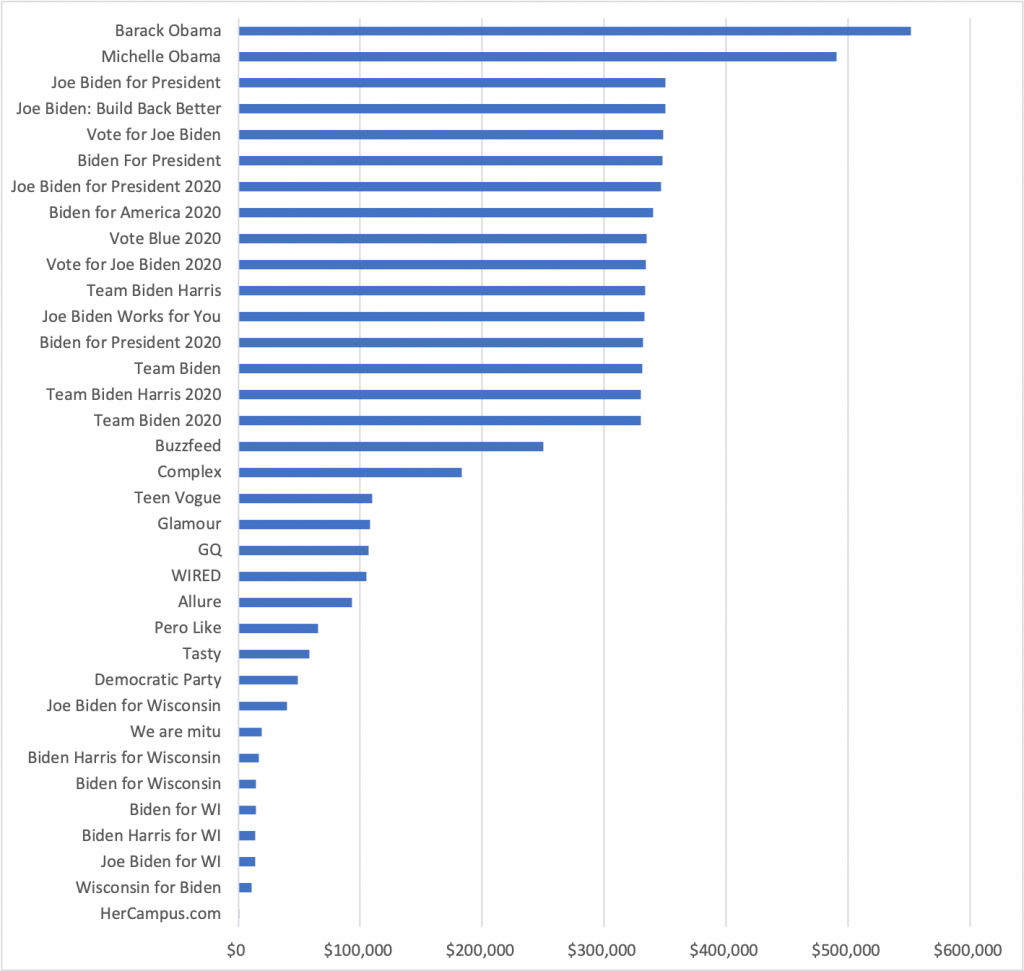
The two official campaigns launched dozens of additional pages on Facebook, including running ads from the pages of media outlets. The Biden campaign ran ads from 38 additional pages, which totaled an additional $12.4 million in advertising between June 1 and November 1, 2020. The largest ad buys ran from the official page for Kamala Harris ($5,375,178), Biden’s Vice Presidential running mate. The remainder totaled $7,037,819 (See Figure 2).
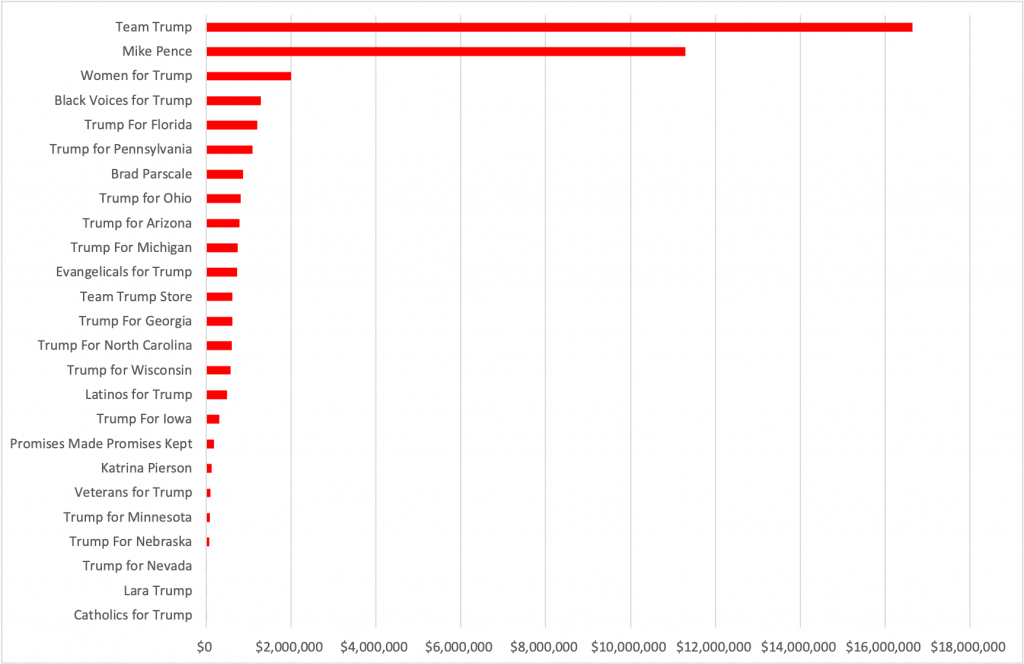
The Trump campaign ran ads from 25 additional pages, and those totaled an additional $41,284,596 between June 1 and November 1, 2020. Unlike the Biden campaign, the largest ad buys were associated with the Team Trump page ($16,638,130), followed by Vice President Mike Pence’s official page ($11,296,060) (see Figure 3).
Demographic Targets
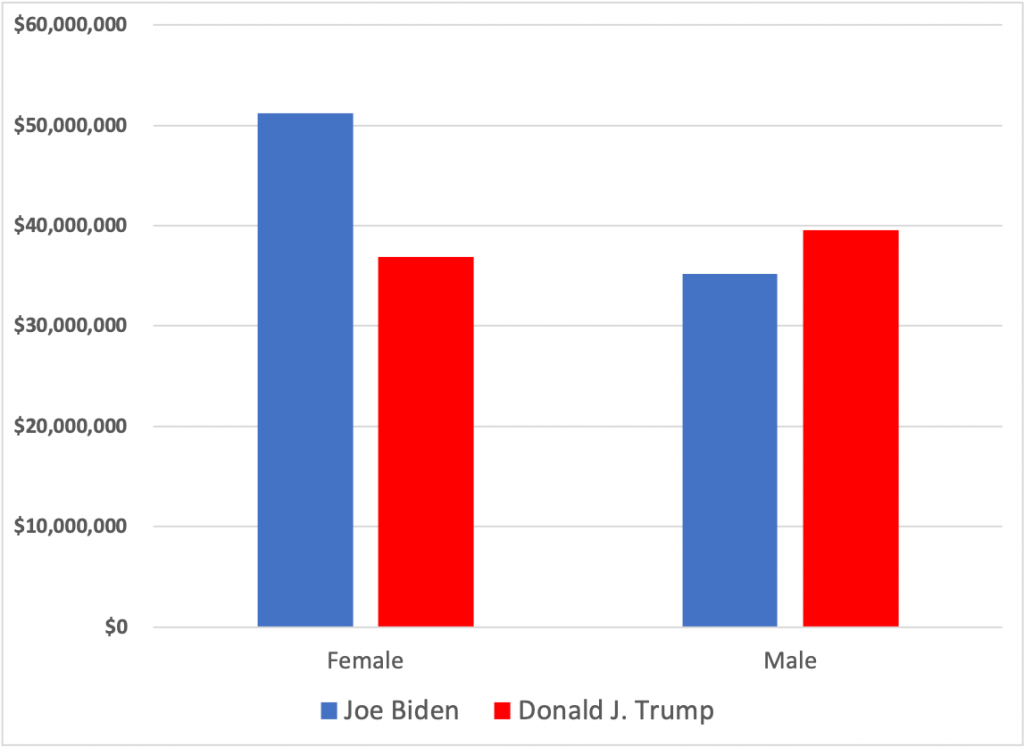
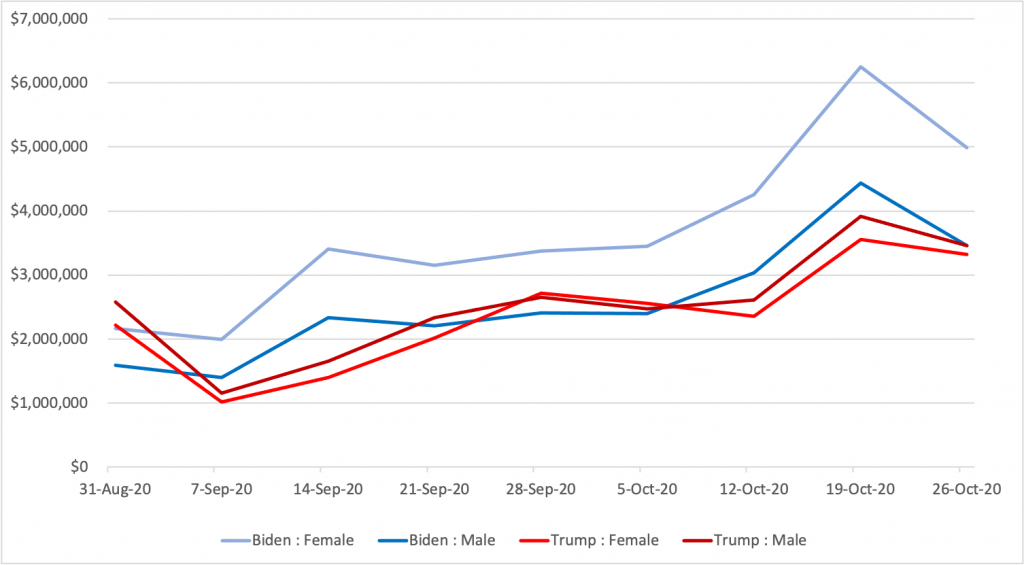
From June 1 until November 1, the overall targeting of demographic groups roughly matched the demographics of the political parties. The Biden campaign ads that ran from the main Biden campaign page targeted women in overall spending at a higher rate than he targeted men, which reflects the gender skew in the Democratic party. The Trump campaign ads associated with the main campaign page targeted men and women roughly at the same rate, with a slightly higher focus on men (See Figure 4).
At the height of their ad buys the week of October 19, Biden’s expenditures for ads targeting women ($6,274,088) were almost double Trump’s ($3,554,189) (See Figure 5).
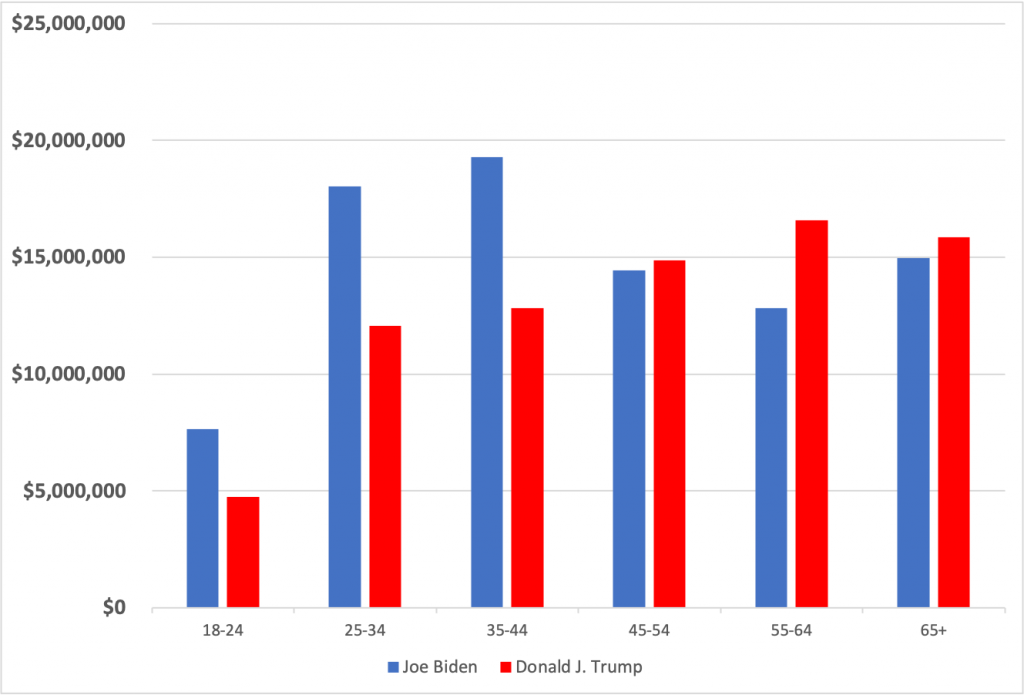
The Biden and Trump campaigns showed distinctly different age targeting strategies. The Trump campaign spent more of their ad budget targeting older people (55+), while the Biden campaign had a greater mix of targeting, with more focus on the 25-44 age brackets. This reflects differences in age demographics of the two parties. Millennials are more likely to lean Democrat, while the Silent Generation (75 to 92 years old) is more likely to lean Republican.
Neither campaign focused resources heavily on the youngest voters–those in the 18-24 age bracket–even though this group most heavily uses social media, especially Instagram. Both campaigns heavily targeted the 65+ category, even though fewer than 50% of Americans in that age bracket are on any social media platforms (See Figure 6).
The campaigns had distinct spending strategies in different geographic regions of the country. For the Biden campaign, the top five largest amounts of ad dollars went to Facebook and Instagram users in the states of Florida ($13,668,633), Pennsylvania ($11,935,256), Michigan ($7,185,689), North Carolina ($5,861,521), and California ($5,609,453). For the Trump campaign, the top five largest ad expenditures went to Florida ($11,007,415), Pennsylvania ($6,178,717), North Carolina ($5,496,098), Texas ($4,622,420), and Michigan ($4,425,967) (See Table 1).
| Biden Top States | Biden Spend | Trump Top States | Trump Spend |
| Florida | $13,668,633 | Florida | $11,007,415 |
| Pennsylvania | $11,935,256 | Pennsylvania | $6,178,717 |
| Michigan | $7,185,689 | North Carolina | $5,496,098 |
| North Carolina | $5,861,521 | Texas | $4,622,420 |
| California | $5,609,453 | Michigan | $4,425,967 |
| Arizona | $4,871,664 | Georgia | $4,395,481 |
| Wisconsin | $4,644,397 | Ohio | $3,732,702 |
| Georgia | $3,417,459 | Arizona | $3,692,359 |
| New York | $3,047,421 | Wisconsin | $3,600,699 |
| Texas | $2,752,191 | California | $3,459,476 |
Over the last five weeks before the election, the strategies of the Biden and Trump campaigns shifted. The campaigns both put more money into advertising on Facebook in many of the critical swing states, but there are noteworthy differences in the two campaigns’ strategies. For example, while the Biden campaign put over $1 million into Minnesota, it was not a major focus of the Trump campaign (See Table 2).
| Biden Top States | Biden Spend | Trump Top States | Trump Spend |
| Pennsylvania | $7,074,437 | Florida | $5,754,026 |
| Florida | $7,021,009 | Pennsylvania | $3,476,657 |
| Michigan | $4,345,247 | North Carolina | $2,950,282 |
| North Carolina | $3,189,327 | Michigan | $2,418,016 |
| Wisconsin | $2,657,708 | Wisconsin | $2,200,166 |
| Arizona | $2,589,071 | Georgia | $2,063,035 |
| Georgia | $2,079,433 | Arizona | $1,877,362 |
| Minnesota | $1,149,541 | Ohio | $1,287,617 |
| Nevada | $1,067,562 | Iowa | $948,741 |
| California | $1,038,227 | Texas | $806,518 |
Ad Content
We use computational methods to categorize the content of the ads along several dimensions: messaging type, tone, and topic. Our classifications are at least 75% accurate for each category.
A few limitations of our analysis: Our analysis focuses only on the text in the ads. As a result, we are likely under-reporting some of the messaging types, especially calls-to-action, that are embedded in the images of the ad.
We are also likely under-reporting some of the content in Biden’s ads. The campaigns run Facebook ads for several reasons. One of those is to conduct A/B testing – testing out several different elements of ads to small audiences to determine which have the greatest engagement. Those that meet the goals of the ad campaign are then run at a much larger target audience. Our research suggests that Biden’s A/B testing relied on scripts that pulled content from a third-party website. That content is not captured in Facebook’s databases and they appear as empty messages when pulled from the API. As a result, we are unable to get the content for those ads.
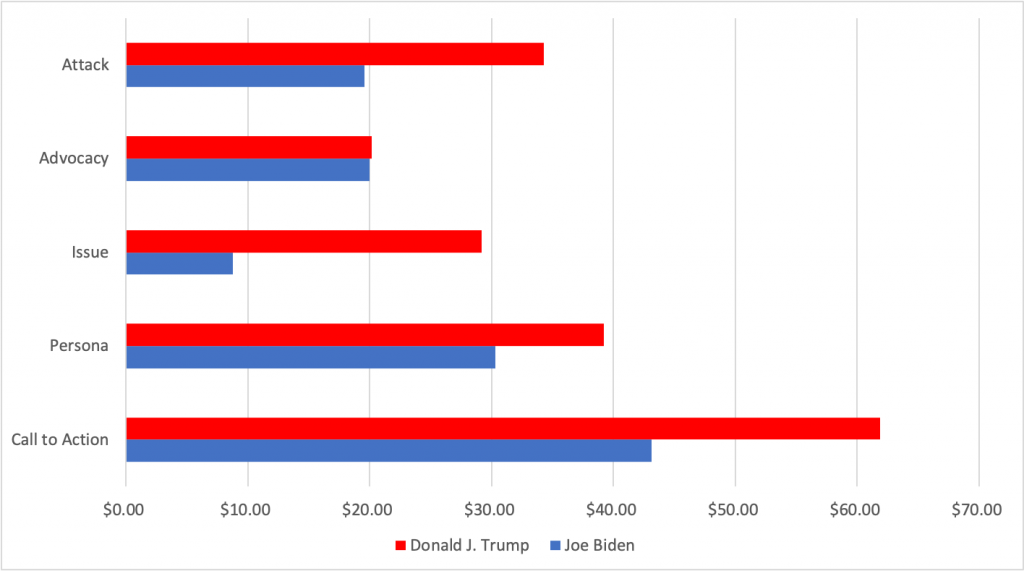
The Trump and Biden campaigns had different spending strategies with regard to the message patterns in their advertisements. We classified each ad for up to five message type categories, including calls-to-action, persona, issue, advocacy, and attack. Calls-to-action include messages urging targets to act (e.g. donate, sign a petition, answer a poll). Persona messaging emphasizes the candidate or their opponents’ personality, character or ability to lead, while issue messaging highlights candidate or opponent issue positions. Advocacy advertising positively emphasizes the candidate’s persona or issue positions, while attack advertising critiques the opponent’s persona or issues positions. Ads can receive multiple classifications.
Both campaigns spent heavily on ads that call targets to act. Both also spent more on ads that talk about their persona than about their issue positions, although Trump spent more on ads that highlighted issue positions than Biden. Both advocated for their own persona and issues at the same rate, but Trump spent more on attack ads than did Biden. (See Figure 7)
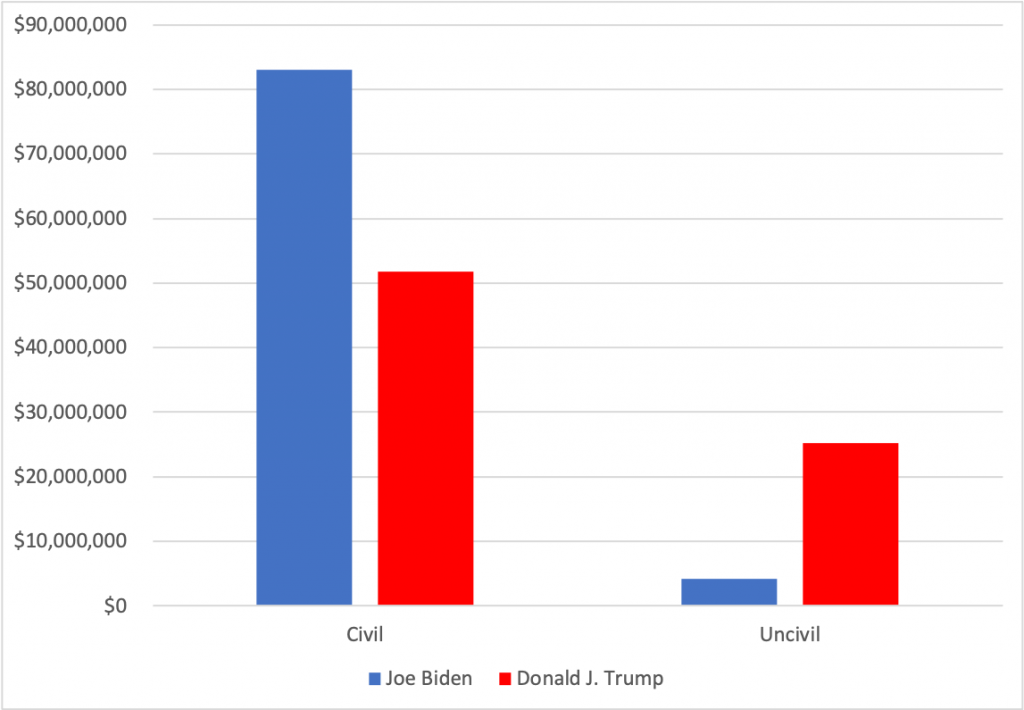
We also analyzed whether an ad exhibited uncivil language. We operationalize incivility as disparaging and derogatory remarks that feature an uncivil tone (e.g. misrepresentative exaggeration, name-calling, lying and deception accusations) targeted at another individual or group. Nearly one-third of Trump’s ads contain evidence of incivility, while a fraction of Biden’s ads were uncivil in tone (Figure 8).
How we conducted our analyses
In 2018, Facebook created an ad library for journalists and researchers. Our project, Illuminating 2020, used the ad library API to track the spending, targets, and content of ad buys on Facebook and Instagram and create a dashboard to visualize the data.
Using computational techniques to classify the content in ads, with at least 75% accuracy for each category, we find noteworthy differences in how the campaigns communicated on the platforms. Our research suggests that advertising largely reflected the demographic trends of the Republican and Democratic Parties and the rhetorical trends of the candidates. Unfortunately, because of the limitations of data reporting from Facebook, it is challenging to ascertain fine-grained micro-targeting practices.
Details about our lexicon-based approach to message topic categorization can be found here.
The analyses in this report are based on data that we pulled from Facebook’s ad library, including the meta-data associated with each ad: spend range, impressions range, target gender, target age, target state. All estimates provided in this report are for Trump and Biden’s main Facebook pages unless otherwise stated.
* Estimate is based on combined spending by the Trump and Biden campaigns across all pages between June 1 and November 1, 2020.
Featured photo by Clay Banks on Unsplash